Journal Comparison Service: analysis of the 2022 data
17/01/2024
The Journal Comparison Service has been developed by cOAlition S to shed light on publishing fees and services. It enables those who procure publishing services to better understand how journals and publishers compare on a range of key indicators.
In this blog post, we provide an overview of the data held within the system, before looking in more detail at the 2022 data. Mindful of the fact that some of these data – especially those that relate to the prices charged for specific services – are considered confidential, we will aggregate and anonymise the data for this report.
Publisher participation: an overview
Table 1, below, provides an at-a-glance summary of publisher participation in the JCS. Between 2021 and 2022, the total number of publishers providing data increased slightly, from 28 to 33. Nevertheless, this number remains disappointingly low, especially in light of the increasingly louder calls for greater price transparency, as evidenced, for example in the recent conclusions from the Council of the European Union, the NIH plan on public access, and a statement from LIBER.
JCS participation
2021
2022
Participating publishers
28
33
Participating journals
2172
1871
Publishers using the IP framework
17
19
Publishers using the FOAA framework
11
14
Journals using the IP framework
2000
1668
Journals using the FOAA framework
172
203
Table 1: participation in the JCS – an overview
Of the 28 publishers who shared data in 2021, all but one (Common Grounds Research Networks) continued to provide data in 2022; a retention rate of 96%.
The data also shows that although both frameworks are being used, the number of titles making use of the IP framework massively outweighs those using the FOAA framework, with some 1668 (89%) journals using the Information Power one in 2022.
Table 1 also shows that despite the slight increase in the number of publishers participating in the JCS, the total number of journals in the 2022 dataset fell from 2171 titles to 1871; a decline of 14%. Detailed analysis at the publisher level (see Annex A) shows that titles published by Wiley were primarily responsible for this reduction, with 23% fewer journals providing data. Most significantly, the overwhelming majority of 391 journals which did not permit Wiley to share their 2022 data, were titles which Wiley publishes on behalf of others, such as learned societies. Efforts will be made to reach out to these societies to encourage them to deposit data, either via Wiley, or by creating their own account on the JCS, in much the same way as EMBO Press have done.
2022 data
For the rest of this blog, we will focus exclusively on the 2022 dataset, and analyse it by APC, discipline, and price and service elements.
We recognise, however, that we can only report on data provided to the JCS and thus the analysis presented may not be applicable to all academic journals and publishers. That said, the dataset is from a diverse set of publishers, publishing across all disciplines and as such is likely to be indicative of general trends.
APC data
Recognising that some publishers may offer different priced APCs, the JCS asks publishers to provide a “low” and a “high” APC. Data provided for these two elements can be identical. Equally, if a publisher charges zero APCs (i.e. Diamond model) then this can also be recorded.
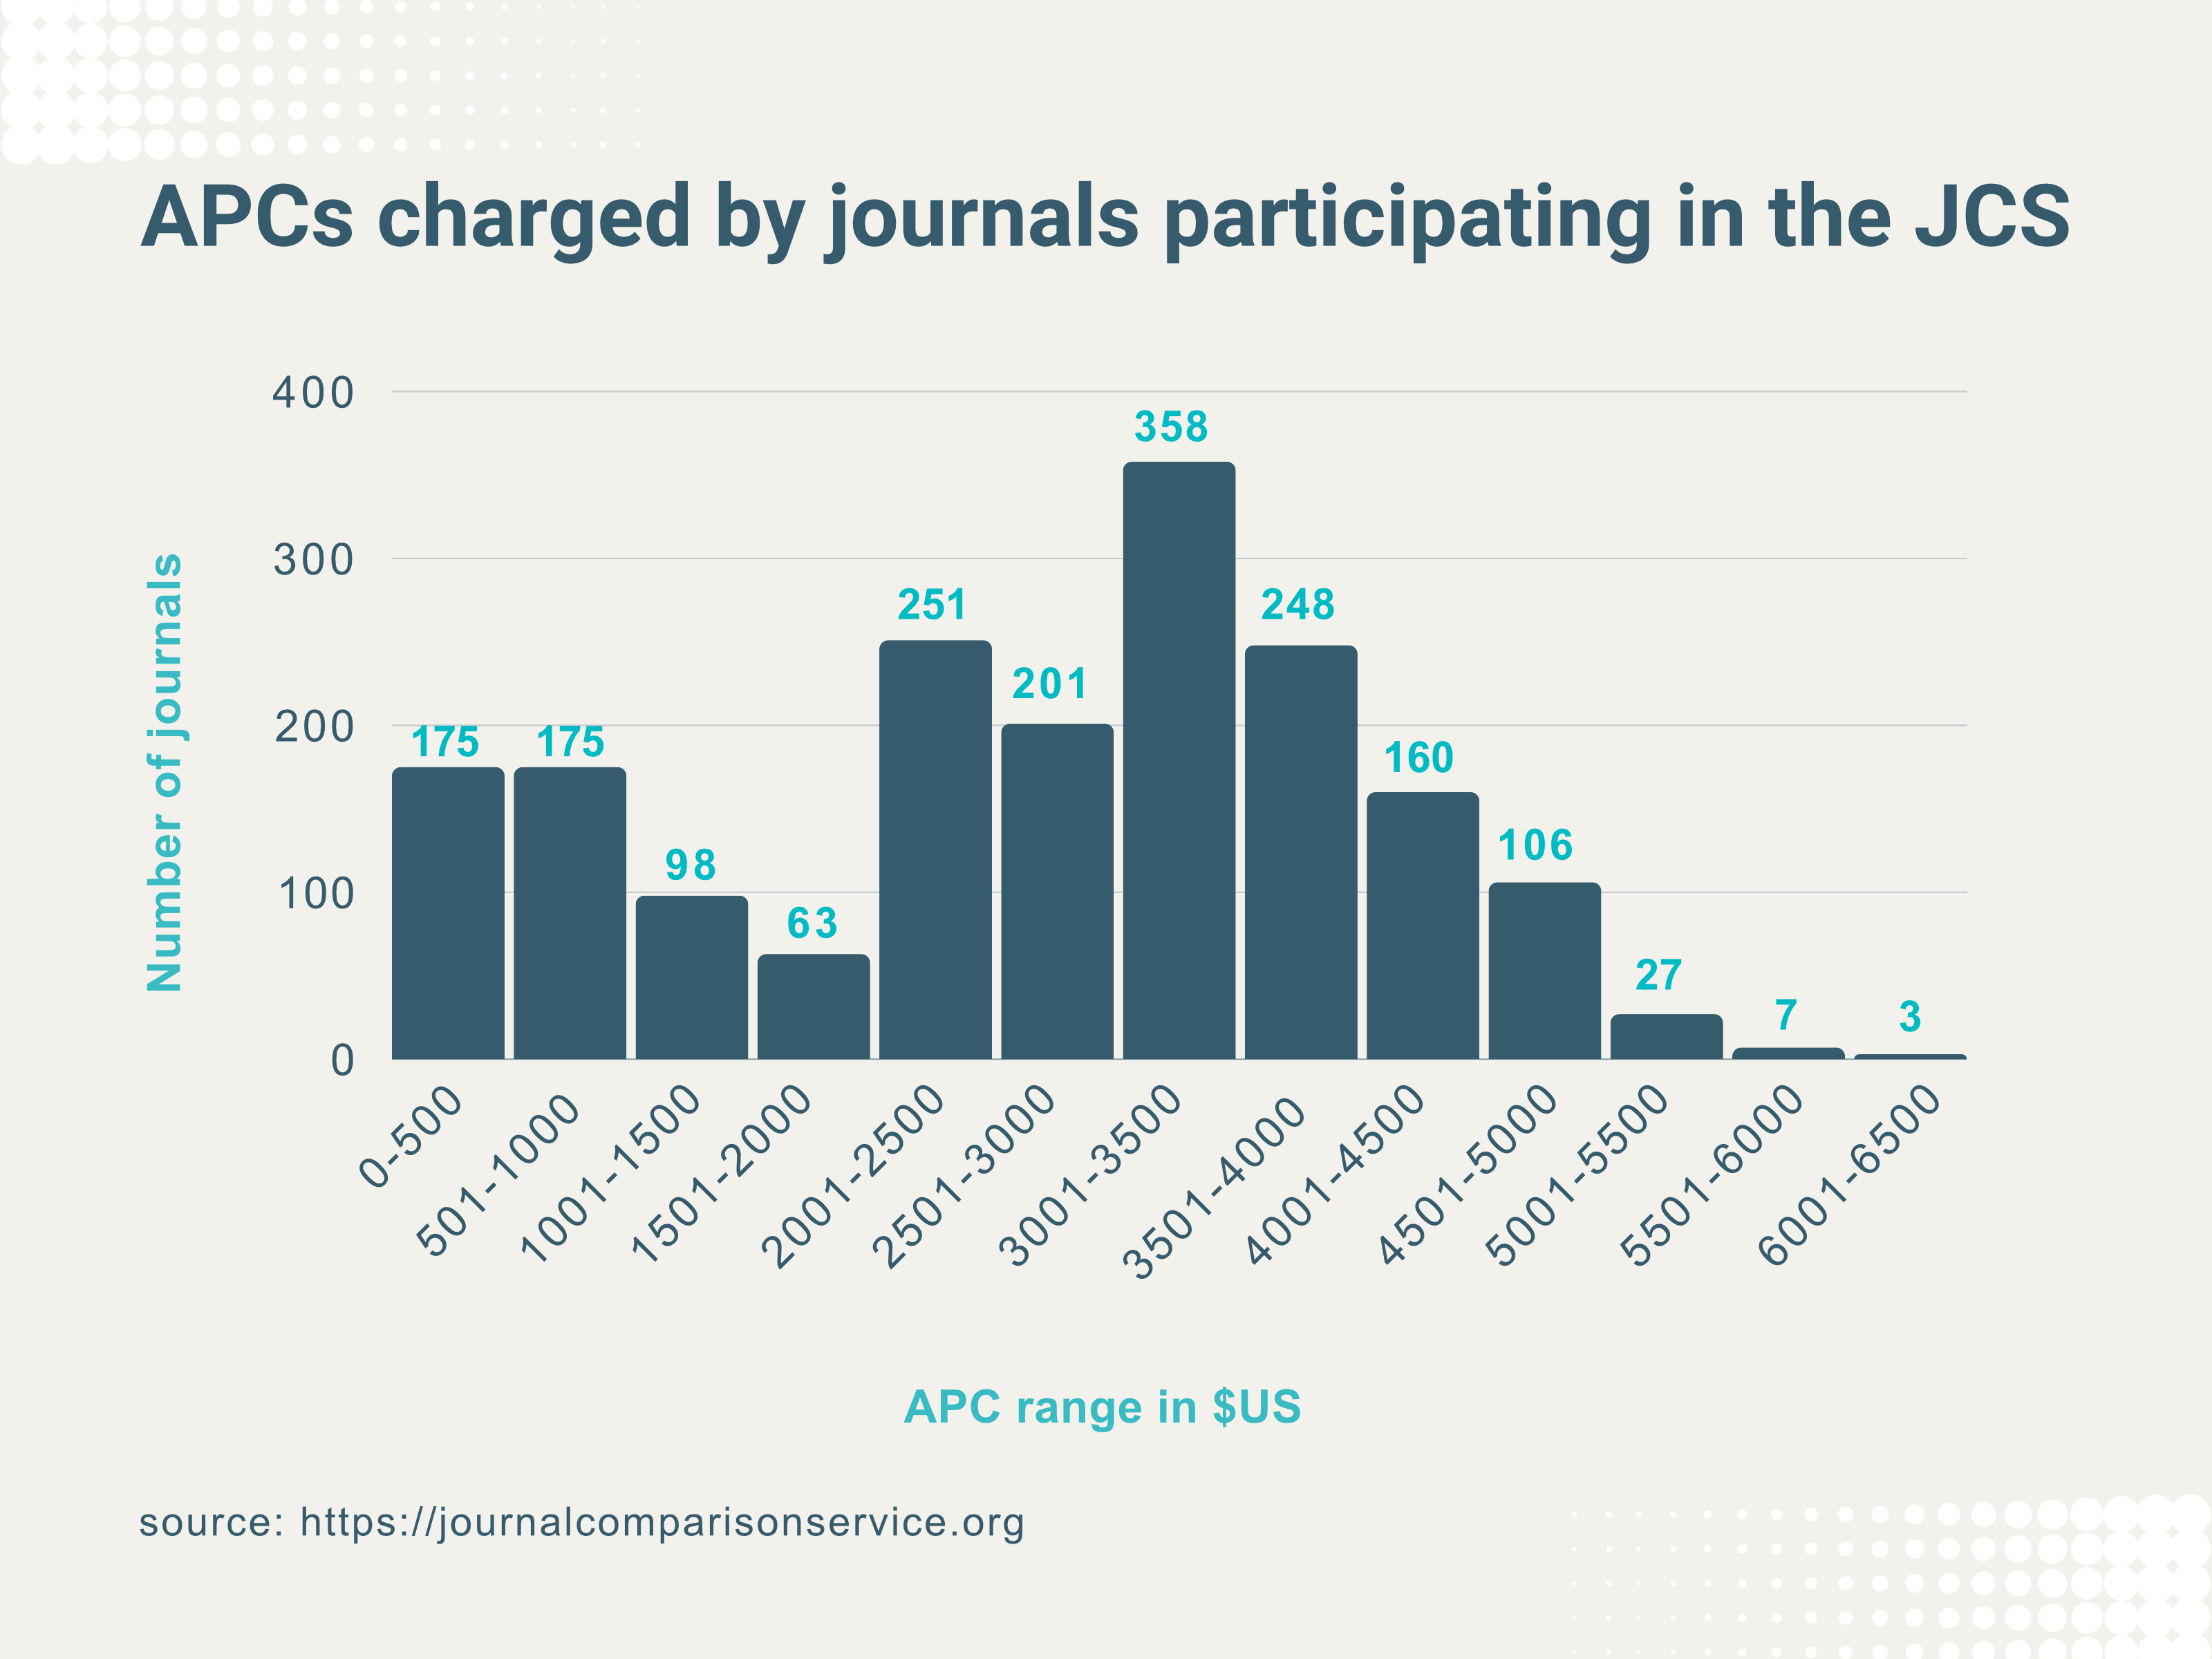
Taking the higher APC figure for 2022 – and having converted all APCs into US$[1], the currency most frequently used by publishers participating in the JCS – Figure 1 shows how the APCs vary over this dataset.
Figure 1: Distribution of APCs
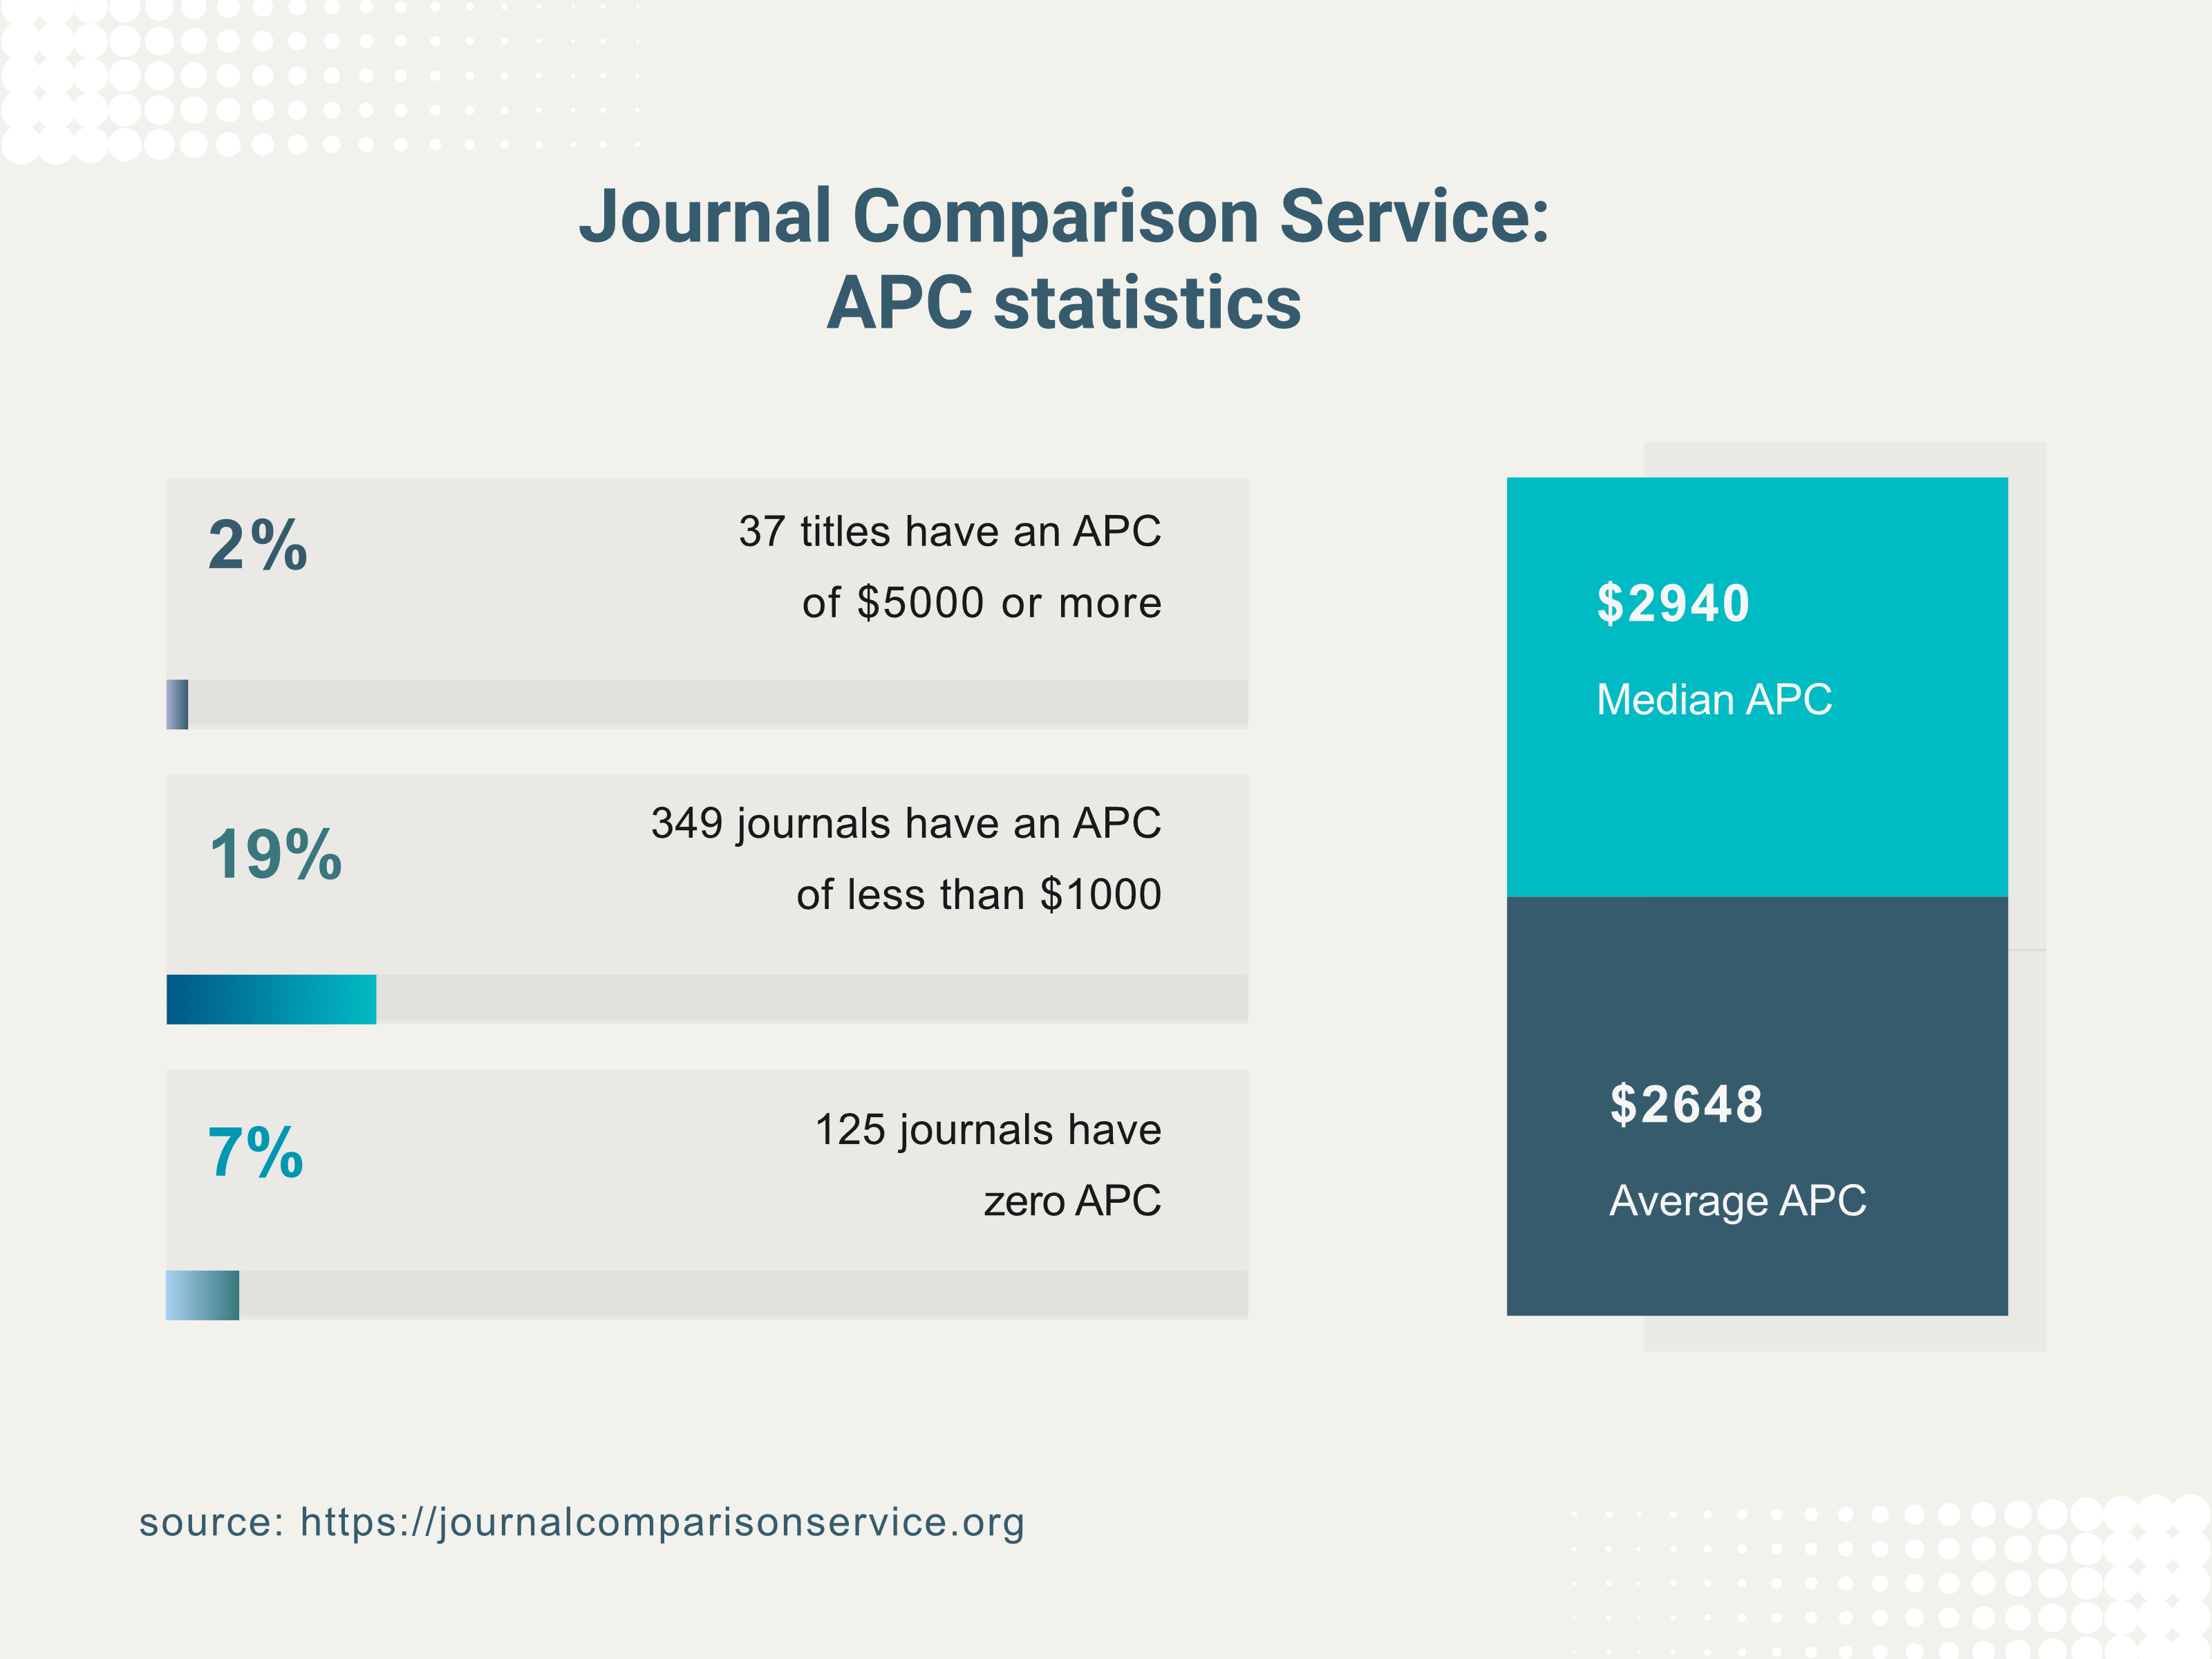
In summary, as shown in Figure 2 below, 125 (7%) journals have an APC of zero, whilst 349 (19%) have an APC of less than $1000. In contrast, some 37 titles have an APC of $5000 or more. The median APC is $2940, whilst the average is $2648.
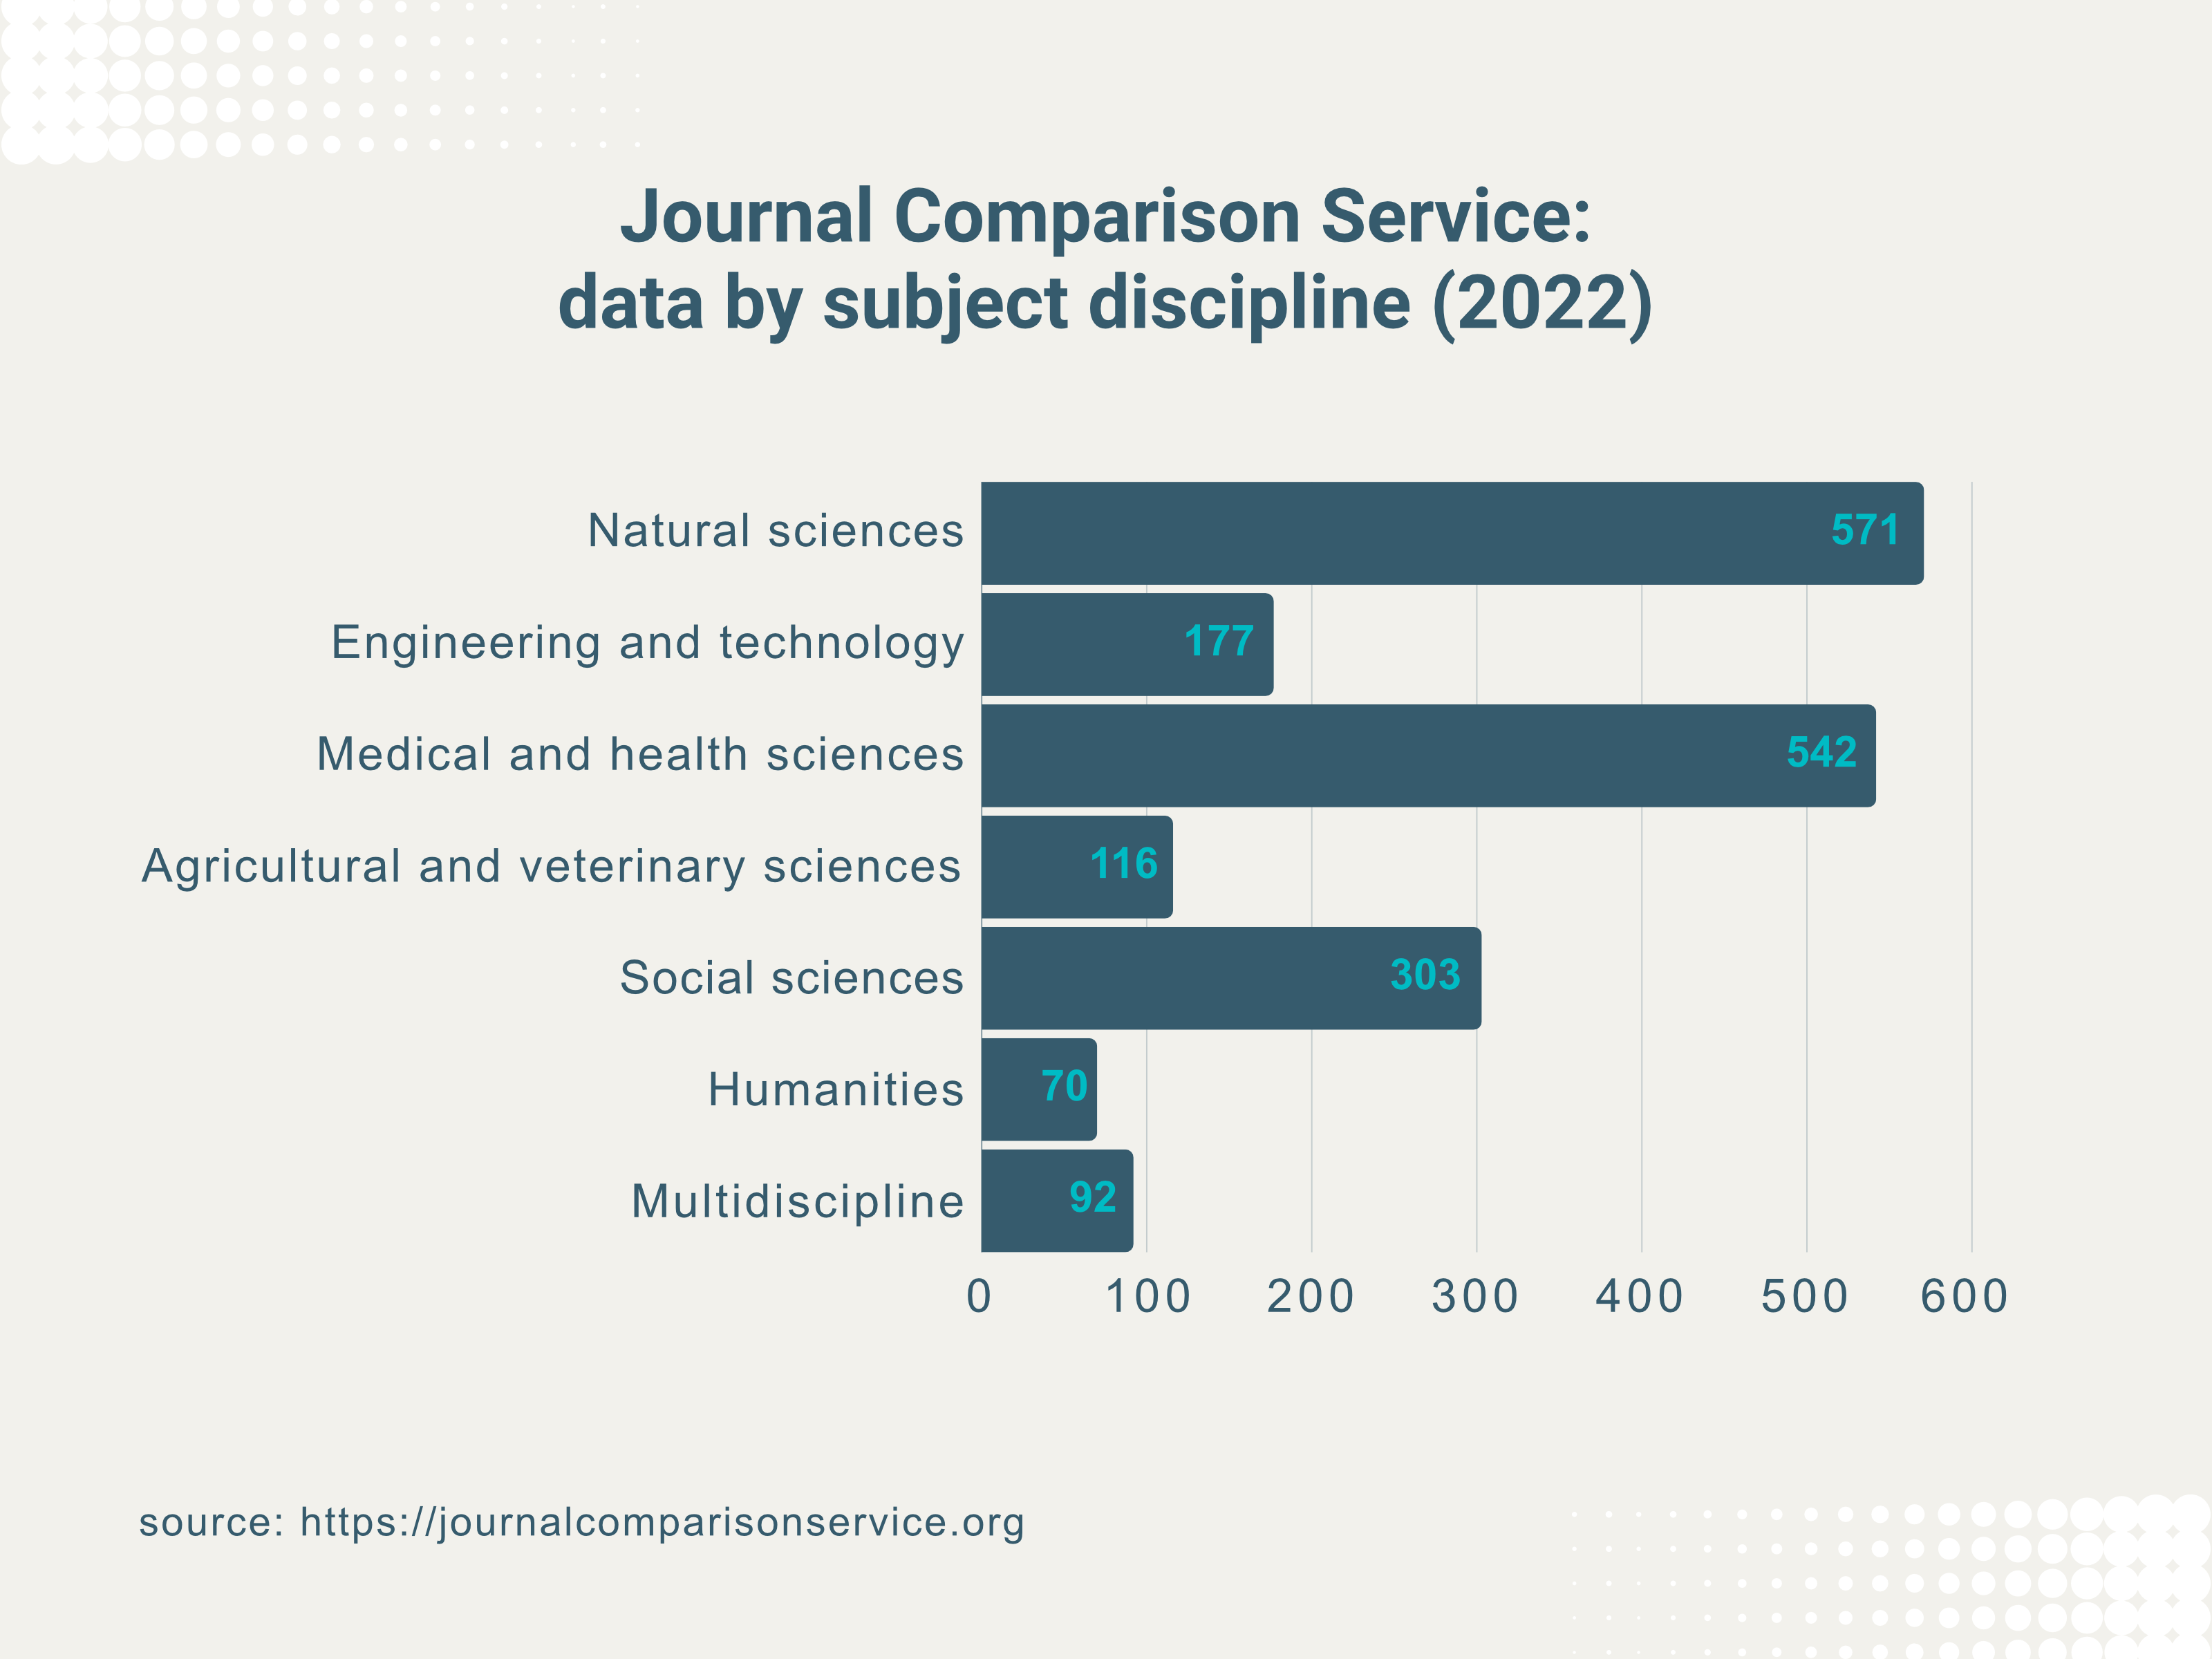
The JCS also requires publishers to provide information about the primary subject discipline of each journal, using the controlled vocabulary set out in the Frascati manual, 2015. The full disciplinary breakdown can be seen in Annex B, but for ease of understanding Figure 3 provides a summary.
Figure 3: JCS data by subject discipline
To understand how disciplinary differences might impact the prices levied for different services, we looked at two broad disciplines, namely ‘medical and health sciences’ (referred to hereafter as MHS) and ‘social sciences / humanities’ (SSH). By combining journals in the humanities and social science disciplines, the number of journals totalled 393, broadly comparable with the number of journals in the MHS discipline. It also ensured that we were comparing similar number of publishers; 10 for the MHS journals, and 12 for the SSH titles.
APCs by discipline
Table 2 provides a summary as to how APCs varied across these two datasets.
Average APC
Median APC
No. titles with APC = $0.00
APC range
MHS titles (n=543)
$2792
$3060
9 (2%)
$0 – $5300
SSH titles(n=393)
$2519
$2940
55 (14%)
$0 – $4940
Table 2: Comparing APCs across disciplines
The broadly similar average and median APCs across both disciplines is surprising, as the common perception is that APCs in SSH titles tend to be lower than in MHS journals. This, however, may be an artefact of the data and the fact that one publisher – Wiley (excluding Hindawi) – is responsible for publishing over 60% of all journals listed in the JCS.
The finding that 14% of all SSH titles in the JCS charge no APCs is broadly in line with other analyses on diamond publishing, which show that this equitable approach to OA is more common in SSH than in other disciplines.
Price & service data
One of the core functions of the JCS is to provide registered End Users with information as to how the various services that publishers provide – managing peer review, copy editing, marketing etc. – contribute to the total price charged.
This however, is made more challenging by dint of the fact that the JCS currently allows publishers to provide data using either the Information Power framework – developed specifically for the JCS – or one based on the Fair Open Access Alliance framework. Although there were sound reasons for supporting both frameworks – not least the fact that some publishers had already started to use the FOAA one – we now believe the time is right to review this decision. The JCS Advisory Panel will discuss a recommendation to move exclusively to the IP framework at their Spring 2024 meeting.
The analysis below uses data from those publishers who provided information using the IP framework.
Focusing on the two broad disciplines discussed above, the following findings emerged (Table 3).
Service/Price element
MHS titles: n=526
SSH titles: n=317
Key service elements
Research articles published (median):
101
52
Acceptance rate (median/average):
24%/27%
21%/26%
Desk rejection rate (median):
60%
69%
Median number of reviews:
2
2
Median no. of days to first decision
22 days
32 days
Median no. of days to undertake peer review
33 days
64 days
Median no. of days from acceptance to publication
20 days
21 days
Price elements – publishers indicate what % of the price is spent on each element. (Table shows median data and thus may not add up to 100%)
Price Breakdown: Journal Community Development
27%
34%
Price Breakdown: Journal Submission on First Decision
7%
6%
Price Breakdown: Peer Review
14%
14%
Price Breakdown: Services Acceptance Publication
15%
12%
Price Breakdown: Services Post Publication
2%
1%
Price Breakdown: Platform Development Support
5%
5%
Price Breakdown: Sales Marketing
10%
8%
Price Breakdown: Author Customer Support
2%
2%
Table 3: Service and price elements in the JCS: MHS vs SSH journals
Note: for definitions of what is included in each service/price element, see here.
Because of the need to aggregate and anonymise the data before publicly sharing it in this blog, Table 4 can only provide a flavour of the potential richness of the JCS.
That said, even at this level, we can see that the median time for SSH titles to make a first decision (desk reject or send a manuscript to peer review) is 32 days, compared with 22 days for MHS titles, whilst the time to manage the peer review process for SSH titles (64 days) is almost twice as long as it takes journals in the MHS disciplines to complete this activity.
In terms of the percentage of the price spent on providing the various services, there is very little difference (at this aggregate level) between the two disciplines. Interestingly, the percentage allocated to managing the peer review service – arguably the most critical service publishers provide – is identical at 14%.
The largest price element in both disciplines is allocated to the “Journal Community Development” price bucket, which is defined as “activities to establish or develop the journal so that articles can be submitted (i.e. identify a need for the journal, its aims and scope development, investment in funding for the field, editorial board costs, commissioning content, competitor analysis, benchmarking, policy development, and portfolio development)”. How useful this catch-all bucket is to those who make purchasing decisions is something the Advisory Panel will be asked to comment on.
Further analysis
As this piece has already made clear, the need to respect the sensitive nature of the JCS data limits what can be disclosed in a public forum. However, registered End Users – on the understanding that they do not share the data outside their organisation – are not subject to these restrictions: they can use the JCS to compare different publishers and different journals to help determine if the price they are being charged is commensurate with the services provided.
If you are involved in procuring publishing services but do not yet have an account on the JCS, applications can be submitted via: https://journalcomparisonservice.org.
Annex A – Publisher participation in the JCS
Name of Publisher
2021: No. of journals in JCS
2022: No. of journals in JCS
About Science
5
5
Beilstein Institute
2
2
Bio-protocol [New in 2022]
0
1
Common Ground Research Networks
66
0
Company of Biologists
5
5
Copernicus Publications
37
41
eLife
1
1
EMBO Press
4
4
European Respiratory Society
4
4
F1000
4
4
Frontiers
126
168
Hindawi
220
235
IWA Publishing
14
14
Institute of Slavic Studies [New in 2022]
0
8
International Union of Crystallographers
10
10
JMIR Publications
25
29
John Wiley
1470
1125
Journal of Universal Computer Science
1
1
Ledizioni
4
7
Meise Botanic Garden
1
1
National Institute of Telecommunications [New in 2022]
0
1
Nordic Africa Research Network [New in 2022]
0
1
Oekom
3
3
Open Library of Humanities
24
24
Pensoft Publishers
42
42
PLOS
7
12
Portland Press [New in 2022]
0
7
Polish Botanical Garden
4
4
PsychOpen GOLD [New in 2022]
0
15
Rockefeller University Press
3
3
Royal College of General Practitioners
2
2
Royal Society of Chemistry
43
47
Royal Society
10
10
Ubiquity Press
35
35
Total
2172
1871
Annex B – JCS titles: breakdown by discipline
Subject
No. of journals
1. Natural sciences
57
1.1 Mathematics
31
1.2 Computer and information sciences
27
1.3 Physical sciences
50
1.4 Chemical sciences
106
1.5 Earth and related environmental sciences
90
1.6 Biological sciences
186
1.7 Other natural sciences
24
2. Engineering and technology
45
2.1 Civil engineering
8
2.2 Electrical engineering, electronic engineering, information engineering
51
2.3 Mechanical engineering
11
2.4 Chemical engineering
8
2.5 Materials engineering
11
2.6 Medical engineering
7
2.7 Environmental engineering
6
2.9 Industrial biotechnology
1
2.10 Nano-technology
3
2.11 Other engineering and technologies
26
3. Medical and Health Sciences
123
3.1 Basic medicine
65
3.2 Clinical medicine
173
3.3 Health Sciences
162
3.4 Medical biotechnology
8
3.5 Other medical sciences
11
4. Agricultural and veterinary sciences
8
4.1 Agriculture, forestry, and fisheries
74
4.2 Animal and dairy science
17
4.3 Veterinary Science
17
5. Social sciences
3
5.1 Psychology and cognitive sciences
86
5.2 Economics and business
99
5.3 Education
18
5.4 Sociology
44
5.5 Law
9
5.6 Political science
17
5.7 Social and economic geography
10
5.8 Media and communications
3
5.9 Other social sciences
14
6.1 History and archaeology
14
6.2 Languages and literature
23
6.3 Philosophy, ethics, and religion
21
6.4 Arts (arts, history of arts, performing arts, music)
7
6.5 Other humanities
5
All disciplines
6
All HSS disciplines
20
All STEM disciplines
66
Total
1871
[1]1605 titles reported the APC in US$. 4 titles used CHF; 133 titles used EUR, 121 titles used GBP and 8 titles used PLN). Average exchange rate from Euro to USD in 2022: 1.0538 USD; Average exchange rate from GBP to Dollar GBP:USD 1.249458, Average exchange rate of CHF in 2022: 1.0481 USD. PLN APCs were 0.
Robert Kiley
Robert Kiley served cOAlition S initially as interim Coordinator (2018-2021) and later as Head of Strategy (2021-2025), aiming to help accelerate the transition to full and immediate Open Access. Prior to this, he was Head of Open Research at the Wellcome Trust, where he was responsible for developing and implementing their open research strategy. Over the past decade, Robert has played a leading role in the implementation of Wellcome's open access policy and overseeing the development of the Europe PubMed Central repository. He also led the development - in partnership with Howard Hughes Medical Institute, the Max Planck Society - of eLife, the open-access research journal, launched in 2012. More recently he championed the work to create a new open publishing platform for Wellcome researchers – Wellcome Open Research.
Robert is a qualified librarian and an Associate Member of CILIP. He is a Board member of Open Research Central and served for 6 years on the ORCID Board of Directors.